Why Does the City Selected in an Energy Model Matter?
Two identical office buildings can produce remarkably different energy-modeling results simply because they are evaluated using different weather files.
Imagine an architect designing a commercial office building in Manhattan. The energy modeler selects a weather file from a distant city because it is readily available in the simulation software library. The building geometry, envelope insulation, high-performance glazing, interior lighting power density, and mechanical HVAC equipment are all modeled with meticulous precision, but the weather dataset does not adequately represent the project's actual microclimate and geographic location.
The simulation software may then calculate substantially different heating demand, cooling demand, solar heat gains, and annual HVAC energy consumption from what a more representative weather file would produce.
A Foundational Simulation Parameter:
Weather is one of the major external boundary condition inputs in building energy simulation. The weather file determines the outdoor environmental conditions under which the entire architectural and mechanical system is evaluated. Choosing an inappropriate location can distort energy predictions, equipment comparisons, life-cycle cost analyses, and fundamental design decisions.
For architects, mechanical engineers, and energy modelers, selecting the right weather data is therefore an essential part of preparing a reliable building energy model.
What Is a Weather File in Building Energy Modeling?
A weather file is a structured digital dataset containing comprehensive meteorological observations and measurements used by building simulation software to represent outdoor environmental conditions across time.
For example, EnergyPlus commonly uses the EnergyPlus Weather (EPW) file format for annual building simulations. These files contain hourly or sub-hourly weather information that enables simulation engines to calculate dynamically how a building's thermal envelope and HVAC systems interact with their external surroundings.
| Weather Variable | Why It Matters in an Energy Model |
|---|---|
| Dry-bulb temperature | Directly influences sensible heating and cooling demand across building zones. |
| Dew-point temperature | Helps evaluate atmospheric moisture content and psychrometric state points. |
| Relative humidity | Influences latent cooling loads, dehumidification requirements, and indoor comfort conditions. |
| Solar radiation | Affects direct and diffuse solar heat entering through windows, curtain walls, and exterior roof surfaces. |
| Wind speed | Influences envelope air infiltration, natural ventilation rates, and exterior surface convection heat transfer. |
| Wind direction | Helps evaluate wind exposure coefficients, facade pressure differentials, and ventilation effects. |
| Atmospheric pressure | Supports accurate thermodynamic calculations involving moist air density and fan power. |
| Cloud cover | Influences diffuse solar radiation fractions and outdoor sky temperature radiative heat exchange. |
| Rain and snow information | Supports moisture transport, surface wetting, and specialized weather-sensitive envelope calculations. |
These atmospheric variables do not operate in isolation; they interact simultaneously. A building's cooling requirement is never determined by outdoor dry-bulb temperature alone. Solar radiation, relative humidity, wind speed, building orientation, fenestration solar heat gain coefficient (SHGC), internal heat gains from occupants and equipment, and outdoor ventilation air volume all influence the net operational load.
How a Wrong Weather File Can Distort Energy Simulation Results
Because a weather file influences multiple thermodynamic modules simultaneously, selecting an unrepresentative or distant weather station distorts far more than just the annual heating or cooling bill.
1. Heating and Cooling Load Calculations
A building modeled in a colder climate zone or higher latitude experiences drastically different heating degree days from an otherwise identical building modeled in a milder coastal area. Similarly, differing summer peak temperatures and elevated wet-bulb conditions dictate different capacities for chillers, cooling towers, and air-handling units.
For example, selecting an upstate or inland airport station with significantly colder winter design conditions would artificially inflate the estimated peak boiler size and annual gas or electric heating consumption of a Manhattan office building. The consequences include overdesigned mechanical plants, incorrect comparisons between heat pump and boiler systems, distorted payback periods, and misdirected capital investments.
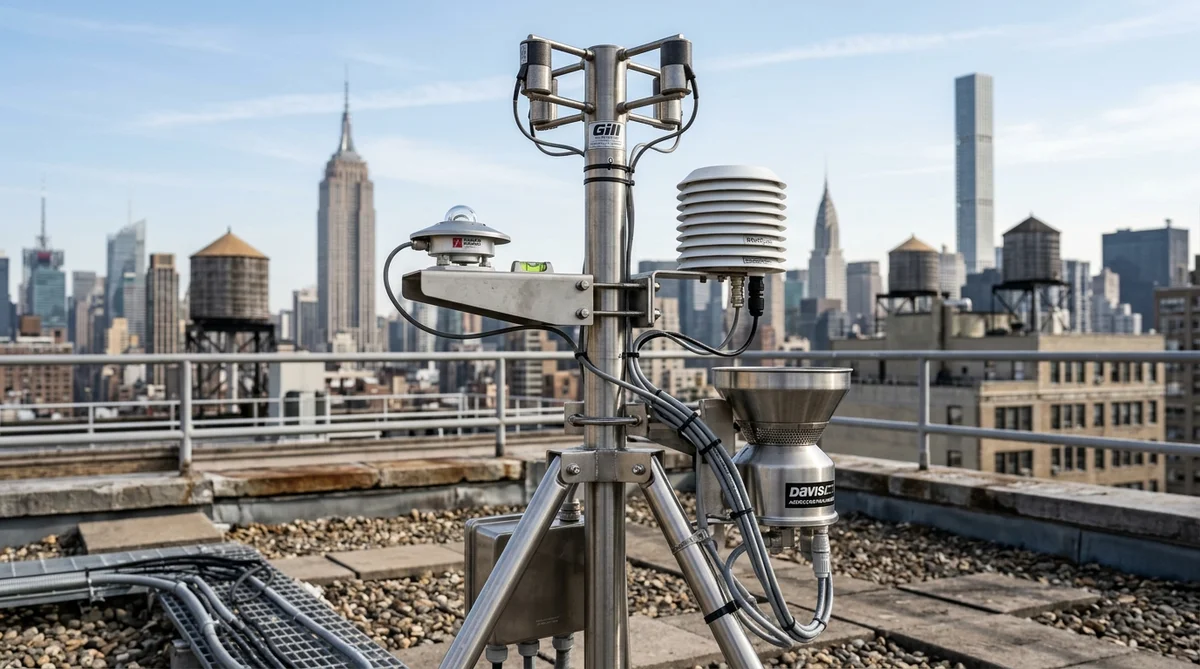 Commercial-grade rooftop weather station instruments: pyranometers, ultrasonic anemometers, and shielded temperature/humidity probes measuring microclimate data.
2. Solar Heat Gain Through Windows
Solar radiation is among the most sensitive inputs in commercial architectural modeling. Two geographical locations can experience nearly identical average dry-bulb temperatures while receiving vastly different distributions of direct normal and diffuse horizontal solar irradiance.
In midtown Manhattan, where high-rise commercial towers feature extensive floor-to-ceiling glass assemblies, solar radiation drives the dominant daytime cooling load. An energy model utilizing mismatched solar irradiance data will miscalculate the effectiveness of low-e coatings, overhang shading devices, dynamic louvers, and facade orientations.
3. Humidity and Ventilation Loads
Humidity considerations are critical when evaluating dedicated outdoor air systems (DOAS), economizer cycles, and energy recovery ventilators (ERVs). Outside air must be conditioned before entering occupied commercial spaces.
In hot, humid summer conditions along the Eastern seaboard, mechanical cooling coils must remove massive amounts of moisture (latent heat) before reducing the dry-bulb temperature. A weather file derived from an inland station with low relative humidity will severely underestimate latent cooling loads, resulting in undersized dehumidification equipment and indoor humidity issues.
4. Wind and Air Infiltration
Local wind velocity and direction directly dictate exterior wind pressure coefficients, driving air infiltration through curtain wall joints, doors, and operable windows. This is particularly relevant for existing building retrofits, naturally ventilated spaces, and tall commercial high-rises subject to the stack effect.
A weather station located at an open coastal airfield experiences intense, unshielded wind speeds compared to a sheltered urban street canyon surrounded by dense skyscrapers. Utilizing unadjusted airport wind data without proper roughness adjustments distorts both natural ventilation and envelope infiltration models.
What Is a TMY Weather File?
One of the industry-standard weather datasets used for annual building energy simulations is the Typical Meteorological Year (TMY) file.
A TMY file does not represent a single historical calendar year. Instead, it is an engineered synthetic year compiled from decades of verified hourly meteorological measurements. For each calendar month, the dataset selects the individual month from the historical record that is most representative of the long-term median climate for that specific location.
For instance, a TMY3 dataset for New York Central Park may incorporate January data from 2004, February from 2011, March from 1999, and so forth, blending them with smoothing algorithms at month boundaries to avoid non-physical discontinuities.
Why Modelers Use TMY Datasets
TMY weather files allow architects, engineers, and code officials to evaluate building designs under standardized, representative annual climatic conditions. They are routinely applied to evaluate:
- Annual heating and cooling energy use: Estimating normalized annual kWh and therm consumption.
- HVAC seasonal efficiency: Evaluating seasonal COP, part-load performance, and heat recovery savings.
- Daylighting and solar gain studies: Analyzing annual daylight autonomy and solar thermal loads.
- Building envelope comparisons: Quantifying energy savings between competing wall and window specifications.
- Energy code compliance submissions: Meeting standardized baseline vs proposed comparison criteria.
Important Modeling Limitation:
A TMY file is specifically designed to represent typical, median conditions. It deliberately filters out statistical outliers. Therefore, a TMY dataset should never be treated as a predictor for a specific future year, nor should it serve as the sole basis for peak HVAC sizing or extreme-weather disaster resilience planning.
TMY vs Actual Weather vs Design-Day Weather
Different simulation objectives require distinct categories of meteorological data. Deploying the wrong dataset type can lead engineers and clients to entirely incorrect conclusions.
| Weather Data Type | What It Represents | Common Engineering Application |
|---|---|---|
| Typical Meteorological Year (TMY) | Representative hourly weather conditions assembled from long-term median historical records. | Annual building energy simulations, code compliance, LEED modeling, and comparative design studies. |
| Actual Meteorological Year (AMY) | Actual weather recorded hour-by-hour during a specific, uninterrupted historical calendar year. | Existing-building energy audits, model calibration against utility billing data, and measurement & verification (M&V). |
| Design-Day Weather | Statistical extreme or percentile-based 24-hour outdoor conditions (e.g., 99.6% heating dry-bulb, 1% cooling coincident wet-bulb). | HVAC equipment peak sizing, boiler and chiller capacity determinations, and emergency backup specifications. |
| Future-Climate Weather | Historical weather morphologically shifted and projected using IPCC climate change models for 2050 or 2080. | Long-term building resilience, lifecycle carbon evaluations, and urban heat adaptation strategies. |
The distinction between annual energy modeling and mechanical sizing is essential. A TMY file predicts typical energy bills over a 12-month period, whereas design-day weather ensures the mechanical chiller plant has adequate cooling capacity during a record-breaking July heatwave.
Likewise, when calibrating a building energy model for an existing NYC property against actual utility bills under Local Law 87 or Local Law 97, modelers must use AMY weather data corresponding to that exact billing calendar year rather than synthetic TMY data.
Why the Nearest Weather Station Is Not Always the Best Choice
It is tempting for a modeler to simply type the project's zip code and click the closest meteorological station. While geographic proximity is a logical starting point, physical distance alone does not ensure climate fidelity.
In a complex metropolitan environment like New York City, nearby stations may be situated in environments that differ fundamentally from the actual project site:
 Consulting energy engineers evaluating ASHRAE 90.1 Appendix G simulation output reports, psychrometric curves, and microclimate variations.
1. Urban Heat-Island (UHI) Effects
Dense concrete buildings, asphalt streets, high vehicular density, and mechanical heat rejection from thousands of air conditioners trap thermal energy in dense urban canyons. Nighttime temperatures in midtown Manhattan can be 5°F to 10°F warmer than surrounding suburban or rural locations. A weather station located outside the urban core will fail to capture the elevated nighttime cooling loads experienced by high-density urban properties.
2. Elevation Differences
Atmospheric pressure, air density, and dry-bulb temperature vary significantly with altitude. Selecting a weather station located at an elevation hundreds of feet higher or lower than the project site introduces errors into fan air-volume calculations, psychrometrics, and convective envelope heat transfer.
3. Coastal vs Inland Exposure
Coastal stations, such as JFK Airport on Jamaica Bay, experience persistent sea breezes, elevated marine humidity, and maritime temperature moderation. By contrast, inland stations experience wider diurnal temperature swings and different solar irradiance characteristics. For a project along the Manhattan or Brooklyn waterfront, a coastal station may provide far more accurate wind and moisture data than an inland airport station.
4. Local Exposure and Microclimates
Proximity to large water bodies, expansive public parks like Central Park, surrounding building geometries, and localized wind funnels create distinct microclimates. Modelers must examine station metadata and surrounding topography before finalizing their weather dataset.
A Practical Example: Modeling an Office Building in New York City
Consider a hypothetical 100,000-square-foot commercial office building in Manhattan. The design team is conducting an energy-modeling study to evaluate the financial feasibility of upgrading from code-minimum double-pane glazing to high-performance triple-glazed low-e window assemblies.
The energy-modeling team considers three candidate weather datasets:
| Candidate Weather Location | Potential Advantage | Potential Limitation |
|---|---|---|
| NYC Central Park Station | Located in the urban core; captures representative regional urban temperature and solar profiles. | Surrounded by park greenery; may show slightly moderated nighttime temperatures compared to deep concrete canyons. |
| LaGuardia / JFK Airport Station | Continuous, high-reliability FAA/NOAA monitoring instrumentation with decades of unbroken hourly records. | Strong maritime exposure, elevated wind speeds, and open airfield solar exposure that differs from sheltered midtown street canyons. |
| Distant Inland Station | Readily available in older software libraries; complete hourly dataset without missing fields. | Significantly colder winter extremes, lower summer humidity, and unrepresentative wind patterns that distort financial ROI. |
Now consider what happens if the energy modeler simulates the proposed triple-pane design using the urban Central Park file, but simulates the baseline code-minimum design using the distant inland airport file.
The resulting difference in energy consumption would reflect both the architectural window upgrade and the radical difference in external climate inputs! The model would produce an invalid comparison that misleads the building owner and fails DOB audit scrutiny.
What Happens When the Weather File Changes?
When an energy modeler switches between weather files, the simulation software recalculates building thermal dynamics across thousands of simulation timesteps. The resulting models show measurable shifts in:
- Annual cooling energy consumption (kWh): Driven by changes in summer dry-bulb peaks, humidity, and direct solar exposure.
- Annual heating energy consumption (therms / kWh): Dictated by winter design temperatures, heating degree days, and nighttime radiative sky cooling.
- Peak cooling and heating plant capacity: Influencing required chiller tonnage, boiler output, and distribution pipe sizing.
- Dedicated outdoor air conditioning energy: Determined by ambient moisture removal and sensible preheat requirements.
- Solar heat gains through glazed surfaces: Affecting perimeter zone comfort, cooling demands, and solar blind control sequences.
- Economizer operating hours: Altered by the total number of hours ambient conditions fall within the free-cooling temperature and enthalpy range.
These variations do not indicate that either simulation algorithm is defective. Rather, they demonstrate that the model is responding dynamically to different physical environments. For this reason, the specific weather file and its source must always be clearly documented in energy reports.
NYC Energy Code: Does Choosing a Different City Change the Climate Zone?
For New York City projects, architects and energy engineers must clearly distinguish between the regulatory code climate zone and the hourly weather station utilized in simulation software.
Under the 2025 NYC Energy Conservation Code (NYCECC), all projects within the five boroughs of New York City are legally assigned to Climate Zone 4A (Mixed-Humid) for determining prescriptive envelope, HVAC, and lighting requirements under Chapter C4.
Regulatory Climate Zone vs Hourly Weather Data:
Climate Zone 4A is an official statutory classification. It does not imply that every block in Brooklyn, Queens, Staten Island, the Bronx, and Manhattan experiences identical hourly temperatures. Selecting a specific representative hourly weather file for an EnergyPlus model does not alter NYC's statutory Climate Zone 4A status. Both must be documented accurately in DOB filing submissions.
Under the 2025 NYC-modified ASHRAE 90.1 compliance pathway, energy modeling reports submitted to the NYC Department of Buildings (DOB) must explicitly state:
- The actual physical project address in NYC.
- The regulatory climate zone (Climate Zone 4A).
- The exact meteorological station identifier, source, and version used for the hourly simulation.
Five Costly Mistakes to Avoid When Selecting Weather Files
A Weather File Selection Checklist for Energy Modelers
Before launching an annual building simulation, run through this quality assurance checklist:
Conclusion
Weather files are not mere background settings in a building simulation program; they represent the entire physical atmosphere that stresses, heats, and cools your building every hour of the year. Selecting the wrong weather location or dataset can skew heating demand, underestimate latent cooling coils, distort envelope financial returns, and jeopardize regulatory code approval.
For New York City projects, while geographic proximity offers a useful starting point, engineers and architects must account for urban heat islands, maritime coastal breezes, elevation differences, and statutory Climate Zone 4A rules.
A reliable energy model always begins with reliable assumptions. Ensuring your simulation uses the right meteorological dataset is a foundational step toward designing an efficient, high-performing building that complies with NYC energy codes and performs in the real world.