Learn how pairing battery energy storage systems (BESS) with rooftop solar maximizes peak shaving and resiliency.
BY NYC Energy Code Team
ON
07 September 2026
Shading Analysis in Solar Feasibility Studies: Why It Matters
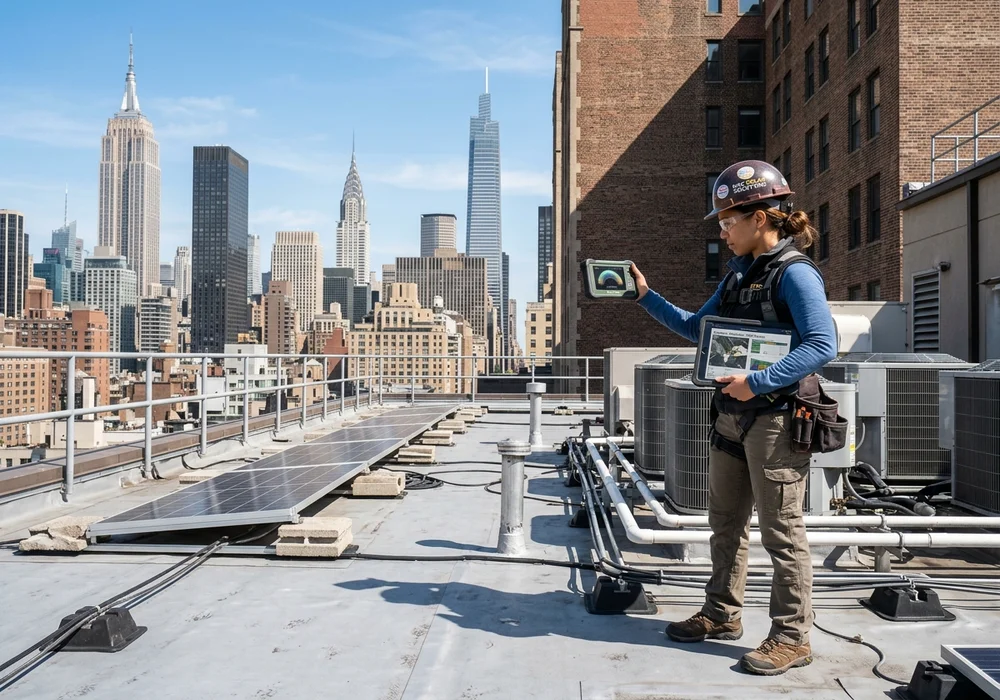
A rooftop may appear wide open and primed for clean power generation during an afternoon walk-through, but appearances can be deceiving. In New York City's dense vertical cityscape, surrounding skyscrapers, elevator bulkheads, cooling towers, masonry parapets, water tanks, and neighboring trees cast complex, moving shadows across roof planes.
That is why a comprehensive shading analysis in solar feasibility studies is a mandatory technical milestone before committing capital to a commercial rooftop photovoltaic (PV) array. For NYC property owners seeking to reduce operational utility costs, achieve Local Law 97 emissions compliance, and capture NYSERDA NY-Sun rebates, an accurate solar access evaluation ensures you invest only in high-yield rooftop zones.
What Is a Solar Shading Analysis?
A solar shading analysis is a physics-based optical simulation that quantifies how much direct, diffuse, and reflected solar irradiance reaches specific coordinates on a roof throughout all 8,760 hours of the year. By mapping the sun's seasonal trajectory against nearby 3D obstructions, engineers calculate the site's Total Solar Resource Fraction (TSRF) and Solar Access Percentage.
Why Shading Matters for Solar Photovoltaic Systems
Solar PV modules generate electrical current through the photovoltaic effect. When even a small portion of a traditional solar string is shaded—such as a single shadow cast by an exhaust pipe—the electrical output of the entire connected string can drop dramatically.
This "Christmas light" effect occurs because shaded photovoltaic cells act as resistors, bottlenecking current flow, activating internal bypass diodes, and creating localized thermal hot spots that accelerate cell degradation.
Common Sources of Rooftop Shading in NYC
1. Adjacent High-Rise Buildings & Air Rights Developments
NYC's vertical density means adjacent towers cast massive shadows. In winter months, when the solar altitude is low, neighboring structures several hundred feet away can shade entire roof planes from mid-morning through late afternoon.
2. Rooftop Mechanical Equipment (HVAC, Dunnage, Chillers)
Packaged rooftop air handling units, cooling towers, ventilation ductwork, and structural steel dunnage create self-shading obstruction zones directly adjacent to prime installation areas.
3. Masonry Parapet Walls & Cornices
High perimeter parapets (mandated by NYC building codes for fall protection) cast persistent low-angle shadows along the southern, eastern, and western roof perimeters, requiring engineered setback buffers.
4. Water Towers & Elevator Bulkheads
Iconic wooden water tanks and elevator stair bulkheads rise 15 to 30 feet above the roof membrane, casting circular and rectangular shadow paths across central roof sections.
5. Urban Street Trees & Foliage Growth
For low-rise and mid-rise residential properties in Brooklyn, Queens, and Upper Manhattan, mature London plane and oak trees create heavy seasonal deciduous shading that shifts dramatically between summer and winter.
How an Engineered Shading Analysis Works
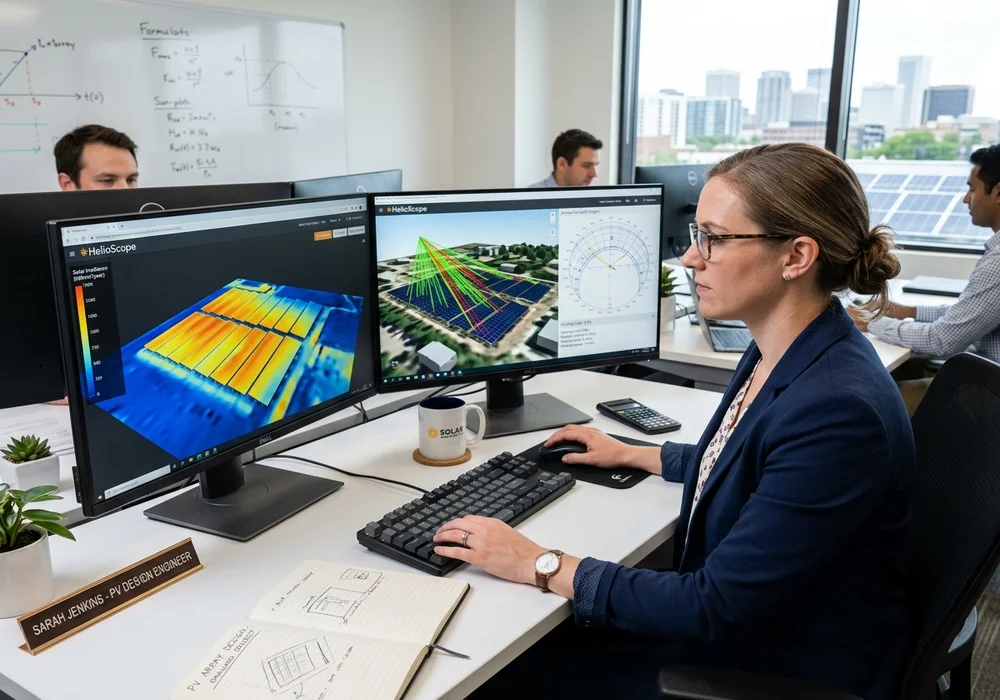
Professional solar engineers combine physical on-site diagnostic tools (such as digital Solar Pathfinders and Solmetric SunEyes) with advanced 3D LiDAR and ray-tracing modeling software (HelioScope, PVSyst, Aurora Solar):
3D Roof CAD Geometry → Surround Obstruction Modeling → 8,760h Sun Path Simulation → Shading Loss Calculation → Optimized Array Layout
The software calculates the exact solar angle (azimuth and elevation) for every minute of the year to determine shade impact on every square foot of roof space.
Seasonal Sun Angle Geometry in New York City
In NYC (Latitude $\approx 40.7^\circ\text{ N}$), solar geometry changes radically across the seasons:
- Summer Solstice (June 21): Sun reaches a high solar elevation of $\approx 72.5^\circ$. Shadows are short, and rooftop solar access reaches peak annual production.
- Winter Solstice (December 21): Sun peaks at a low solar elevation of only $\approx 25.8^\circ$. Obstruction shadows stretch almost three times longer, severely encroaching on south-facing array rows.
- Spring & Fall Equinoxes: Median solar angles of $\approx 49.3^\circ$ determine baseline inter-row module spacing.
Worked Example: Rooftop Zone Solar Potential
| Rooftop Zone | Obstruction Profile | Annual Solar Access (%) | Specific Yield (kWh/kWp/yr) | Design Recommendation |
|---|---|---|---|---|
| Zone A (Central Flat Roof) | Unobstructed, >15ft setback from bulkheads | 94% – 98% | $1,250 - 1,320\text{ kWh/kW}$ | High-density ballasted PV array. Top priority. |
| Zone B (South Perimeter) | Low 3ft parapet wall shading low winter sun | 82% – 88% | $1,080 - 1,150\text{ kWh/kW}$ | Install with 6ft setback buffer or raised racking. |
| Zone C (North of Elevator Bulkhead) | Direct shadow cast from 20ft masonry bulkhead | 48% – 62% | $620 - 780\text{ kWh/kW}$ | Do not install panels. Dedicate to FDNY pathways. |
Optimizing Layouts with Module-Level Power Electronics (MLPE)
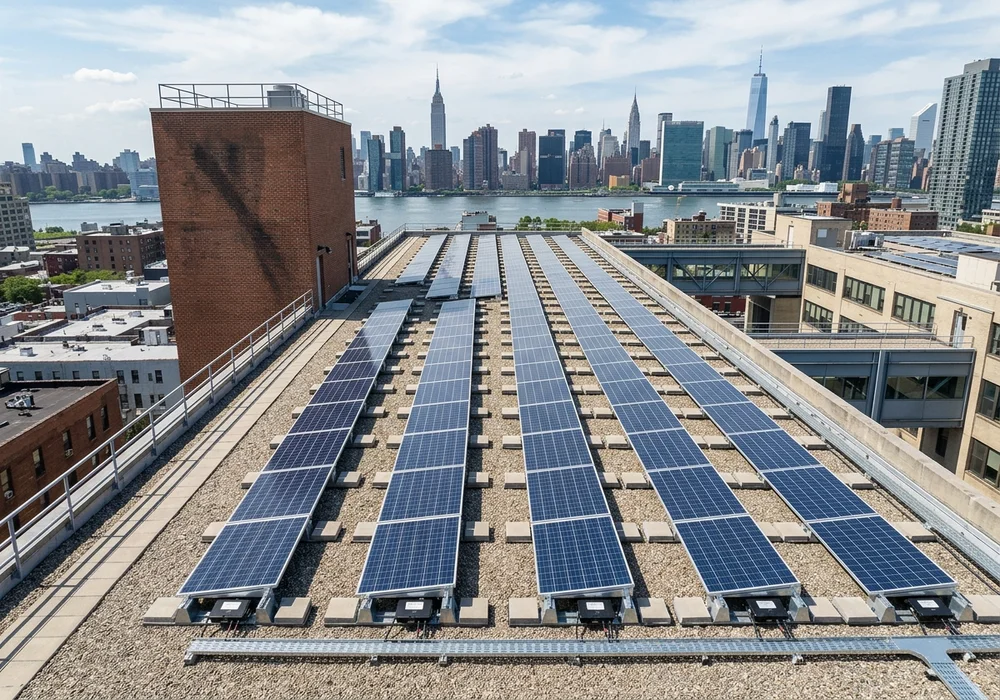
A thorough shading study enables smart engineering interventions that salvage energy production in partially shaded urban spaces:
- DC Power Optimizers & Microinverters: By equipping each solar panel with individual Maximum Power Point Tracking (MPPT), shaded modules operate independently without pulling down the performance of adjacent unshaded panels.
- Optimized Inter-Row Spacing: Spacing panel rows to prevent front modules from casting shadows on rear modules during 10:00 AM – 2:00 PM winter solar windows.
- Elevated Solar Canopies: Raising the solar racking structure 9 to 10 feet above rooftop mechanical equipment and parapets, eliminating localized shade while preserving roof maintenance access.
Visual Rooftop Inspection vs. Engineered Shading Analysis
| Evaluation Feature | Basic Visual Rooftop Inspection | Engineered 3D Solar Shading Analysis |
|---|---|---|
| Solar Window Scope | Single snapshot in time (day of visit) | 8,760 hours of annual solar irradiance data |
| Seasonal Tracking | Cannot predict winter low-angle shadow paths | Simulates exact azimuth & elevation across all 12 months |
| Energy Yield Output | Rough rule-of-thumb wattage guesses | Calibrated kWh annual generation with $\pm 3\%$ confidence |
| Incentive Compliance | Insufficient for NYSERDA NY-Sun incentive submittals | Provides required Total Solar Resource Fraction (TSRF) report |
Solar Shading Feasibility Checklist
Surrounding Obstruction Survey: Map heights and distances of neighboring buildings and zoning envelopes.
Rooftop Mechanical Asset Audit: Measure heights of cooling towers, dunnage, water tanks, vents, and parapets.
LiDAR & 3D Ray-Tracing Simulation: Model 8,760-hour solar access percentages in HelioScope or PVSyst.
TSRF Calculation: Confirm site meets NYSERDA NY-Sun minimum solar access thresholds (≥ 70% TSRF).
Inverter & MLPE Topology Selection: Specify DC optimizers or microinverters for partially shaded perimeter strings.
FDNY Fire Path & Setback Coordination: Integrate mandatory 6-foot FDNY perimeter access clear paths into layout.
Conclusion
Shading analysis is not an optional add-on in an urban solar project—it is the engineering cornerstone that separates high-performing, profitable solar arrays from underperforming assets.
By modeling annual sun paths, accounting for dense NYC obstructions, optimizing module tilt and row spacing, and selecting appropriate MLPE architecture, building owners can deploy solar with complete confidence in their long-term kilowatt-hour yields, financial ROI, and Local Law 97 emissions offset credits.
Partner with a certified solar engineering and feasibility team to conduct a 3D shading study and unlock the full clean energy potential of your building.
Frequently Asked Questions
Shading reduces the amount of sunlight available to solar panels and can lower electricity production. An analysis helps estimate those impacts before installation.
Common sources include neighboring buildings, rooftop mechanical equipment, parapets, water tanks, elevator bulkheads, and trees.
It can be. The sun is generally lower in the sky during winter, which can produce longer shadows from surrounding buildings and rooftop structures.
They can, but expected production should account for the shading. Panel layout and system design can sometimes reduce the impact of partial shading.
No. It is one component of a complete feasibility study. Structural capacity, roof condition, electrical infrastructure, utility interconnection, permitting, project cost, and expected energy production also need to be evaluated.