Introduction: More Data Does Not Automatically Mean Better Building Management
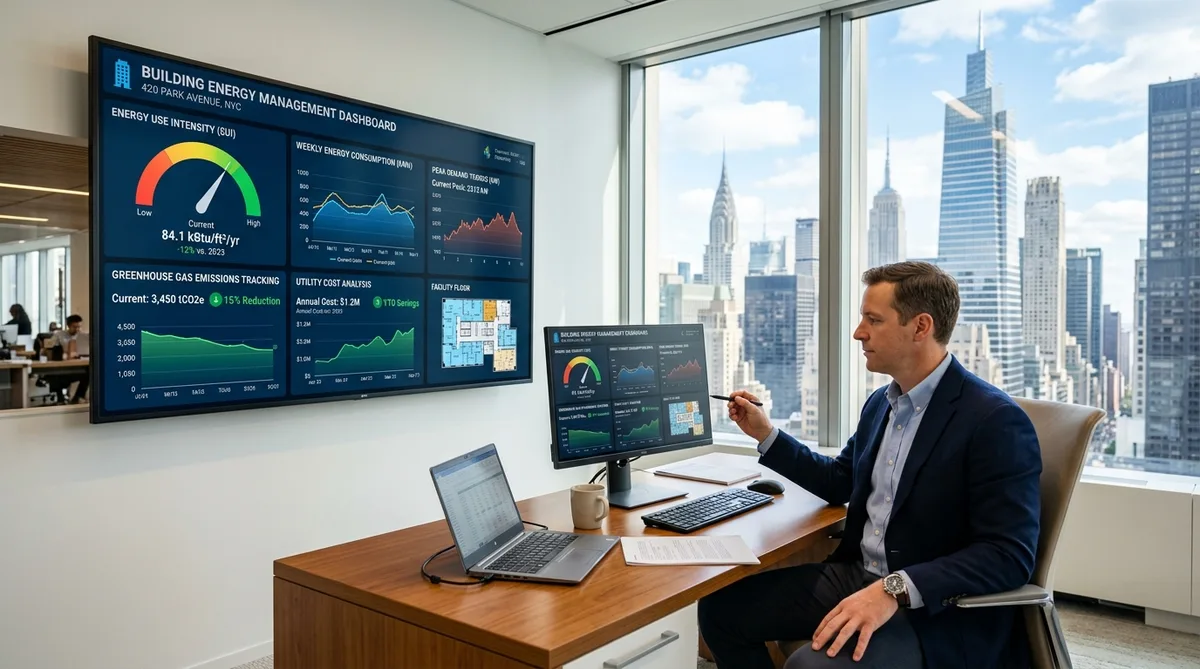
A building energy dashboard can show hundreds of data points: electricity consumption, gas usage, HVAC runtime, indoor temperatures, utility costs, carbon emissions, lighting schedules, and equipment alarms.
But which of those numbers should a building owner actually watch?
The problem with many energy dashboards is that they display information without making it clear what requires attention. A graph may show that electricity consumption increased by 12%, but it does not explain whether the increase came from colder weather, longer operating hours, an equipment fault, or higher tenant occupancy.
For property owners, the purpose of an energy dashboard is not to monitor every available sensor. It is to identify changes that affect operating costs, equipment performance, energy efficiency, and regulatory exposure.
A useful dashboard should answer four questions:
- Is the building consuming more energy than expected?
- When and where is that energy being consumed?
- Is the building paying more than it should?
- Is its energy and emissions performance moving toward or away from compliance targets?
For NYC property owners, these questions have additional importance because benchmarking and emissions reporting obligations can make energy data relevant to both operating budgets and regulatory planning.
Executive Rule: Focus on Decisions, Not Raw Sensor Noise
An executive dashboard should separate operational signals from ambient background data. Core metrics such as weather-normalized EUI, peak electrical demand (kW), cost intensity per square foot, and greenhouse gas compliance buffers directly drive financial and legal outcomes under NYC Local Laws 84 and 97.
1. Energy Use Intensity (EUI): The First Metric to Watch
Energy Use Intensity, commonly called EUI, measures how much energy a building consumes relative to its floor area.
The basic calculation is:
For example, consider an office building with 100,000 square feet of gross floor area that consumes 8,000,000 kBtu annually.
| Measurement | Value |
|---|---|
| Annual energy consumption | 8,000,000 kBtu |
| Gross floor area | 100,000 sq. ft. |
| Calculated EUI | 80 kBtu/sq. ft./year |
The dashboard should display EUI alongside historical performance, rather than presenting it as an isolated figure.
A rising EUI can indicate several issues: inefficient HVAC operation, excessive lighting consumption, poor control schedules, or changes in building usage. However, it does not automatically prove that the building's equipment has become less efficient. Changes in occupancy, operating hours, or tenant activity can also affect the result.
Site EUI vs. Source EUI
These two measurements answer different questions.
| Metric | What It Measures | Best Use |
|---|---|---|
| Site EUI | Energy consumed at the property | Tracking changes in building-level energy consumption |
| Source EUI | Energy consumption plus upstream generation and delivery losses | Comparing overall energy performance across buildings |
| Weather-Normalized Site EUI | Site energy adjusted for weather conditions | Comparing the same building across different weather years |
| Weather-Normalized Source EUI | Source energy adjusted for weather conditions | Longer-term performance comparisons |
ENERGY STAR Portfolio Manager uses source EUI as the basis for its ENERGY STAR score. Site EUI remains useful for understanding how energy consumption at an individual property changes over time.
Put weather-normalized EUI on the main performance dashboard. Keep site and source EUI available for deeper analysis, and do not compare buildings without considering differences in property type and operating conditions.
2. Monthly Energy Consumption: Identify Changes Before They Become Expensive
Annual EUI is useful for benchmarking, but it is not designed to identify every operational problem as it develops.
Monthly energy consumption helps owners identify unusual changes much earlier.
A practical dashboard should separate consumption by fuel or utility:
| Energy Source | What to Monitor | Potential Warning Sign |
|---|---|---|
| Electricity | Monthly kWh consumption | Unexpected increases during normal operations |
| Natural gas | Monthly therms or equivalent energy | Higher consumption outside heating periods |
| Fuel oil | Gallons consumed | Unexpected fuel demand or inefficient heating |
| District steam | Monthly usage | Increased demand without a corresponding change in building conditions |
| District chilled water | Monthly usage | Unusual cooling demand or operating schedule changes |
Consider an office building that normally consumes approximately 120,000 kWh per month. Its latest monthly reading shows 155,000 kWh.
That is an increase of approximately 29%.
The dashboard should flag the change, but it should not immediately label it an equipment failure. The facility manager should check:
- Whether the billing period contains more days than usual.
- Whether tenant occupancy or operating hours changed.
- Whether cooling or heating equipment operated longer.
- Whether temporary equipment or construction loads were added.
- Whether the meter reading is estimated or incorrect.
The objective is to identify the cause of an increase, not merely report that it happened.
3. Peak Electrical Demand: The Metric That Consumption Charts Often Miss
Total electricity consumption and peak electrical demand are not the same thing.
Consumption, measured in kWh, describes how much electricity a building uses over time. Demand, measured in kW, describes the rate at which electricity is being used at a particular point or billing interval.
This distinction matters because some electricity tariffs include demand-related charges. A building can reduce its monthly kWh consumption while still experiencing an expensive peak demand event.
For example, a property might normally operate at 350 kW but reach 520 kW when chillers, pumps, elevators, and EV chargers operate simultaneously.
That short-lived peak may influence the electricity bill, depending on the utility tariff and billing arrangement.
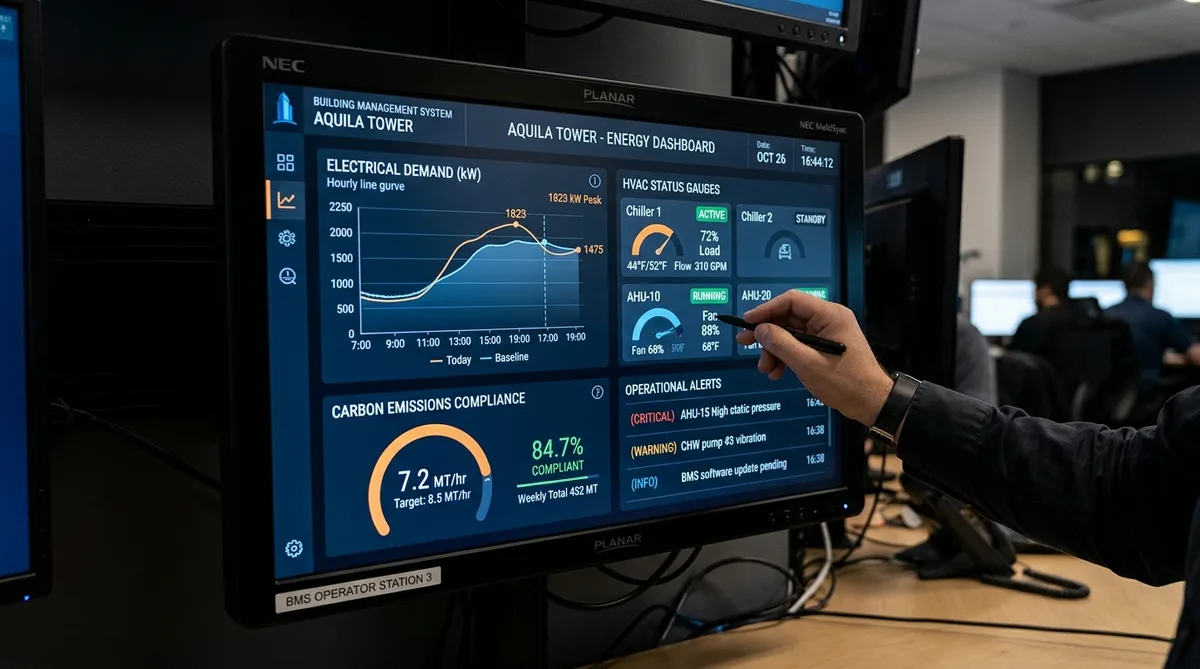 Real-time building energy management interface tracking 15-minute electrical demand (kW) curves alongside HVAC equipment status and automated operational alerts.
A useful demand dashboard should include:
- Maximum demand in kW.
- Date and time of the highest demand.
- Demand trend by day and hour.
- Demand during occupied and unoccupied periods.
- Major equipment operating during peak periods.
- Demand-charge cost, where applicable.
Why Peak Demand Matters for NYC Buildings
Large commercial buildings frequently operate multiple high-load systems at the same time. Cooling equipment, domestic hot-water systems, elevators, kitchen equipment, and EV charging infrastructure can contribute to simultaneous demand.
The dashboard can help identify opportunities to stagger equipment startup, schedule EV charging, or reduce unnecessary simultaneous operation.
However, load management must respect equipment requirements, ventilation needs, comfort conditions, and electrical safety limits.
Track peak demand separately from total electricity use. A building can have lower overall consumption and still have an expensive demand profile.
4. Energy Cost Per Square Foot: Connect Technical Performance to the Budget
Energy consumption tells owners how much energy the building uses. Energy cost tells them what that consumption means financially.
A dashboard should display both total utility expenditure and energy cost intensity.
For example:
| Measurement | Value |
|---|---|
| Annual utility expenditure | $240,000 |
| Gross floor area | 120,000 sq. ft. |
| Annual energy cost intensity | $2.00/sq. ft. |
This makes it easier to compare operating costs between properties of different sizes.
However, cost intensity should not be treated as a pure efficiency metric. Utility prices, demand charges, supply contracts, taxes, and delivery charges can all change the result independently of building efficiency.
A more useful financial dashboard separates:
| Cost Category | Why It Matters |
|---|---|
| Electricity charges | Tracks the cost of purchased electricity |
| Natural gas charges | Shows heating and fuel expenditure |
| Demand charges | Identifies costs associated with peak electrical demand |
| Delivery and distribution | Separates utility delivery expenses from energy supply |
| Total utility expenditure | Shows the full financial impact |
| Cost per square foot | Supports portfolio-level comparison |
Portfolio Manager's total-cost metric can include energy, delivery, distribution, transmission, taxes, and other bill components. Owners should therefore make sure their dashboard uses complete and consistently defined billing data.
5. Greenhouse Gas Emissions: Essential for NYC Compliance Planning
Energy dashboards should not stop at electricity and fuel consumption. They should also show the greenhouse gas emissions associated with building operations.
This is especially relevant for NYC owners who may be subject to Local Law 97.
The dashboard should track:
- Total annual greenhouse gas emissions.
- Emissions by energy source.
- Electricity-related emissions.
- On-site fuel-combustion emissions.
- Emissions per square foot.
- Applicable annual emissions limit.
- Remaining compliance margin or projected excess.
A simplified operational calculation is:
Example: Tracking an Emissions Budget
Assume a hypothetical covered building has:
| Measurement | Value |
|---|---|
| Applicable annual emissions limit | 250 metric tons CO₂e |
| Current projected annual emissions | 220 metric tons CO₂e |
| Remaining margin | 30 metric tons CO₂e |
The dashboard should show the remaining 30 metric tons as a compliance margin, not as a guaranteed year-end result.
If emissions rise during the remaining months, the margin can shrink. A forward-looking projection is therefore more useful than a display of last year's emissions alone.
Important: Do Not Confuse Benchmarking Emissions With LL97 Compliance Calculations
ENERGY STAR Portfolio Manager provides greenhouse gas emissions metrics, including location-based and market-based calculations. Those metrics are useful for general environmental reporting and performance tracking.
However, an LL97 compliance dashboard must use the applicable NYC regulatory methodology, emissions factors, building classification, and reporting rules. A general-purpose emissions figure should not automatically be treated as the official LL97 result.
NYC DOB has also moved to emissions limits based on ENERGY STAR Portfolio Manager property types. Beginning with calendar year 2026, owners must report using those property types. The relevant classification and applicable limit should therefore be checked rather than copied from an older dashboard configuration.
For covered properties, the LL97 dashboard should connect operational emissions data to the building's actual regulatory pathway. NYC DOB's LL97 guidance provides the relevant compliance information.
6. HVAC Performance: Find Problems Behind the Energy Numbers
HVAC systems often account for a significant share of building energy consumption. Yet a dashboard that only displays total electricity and gas consumption cannot explain whether heating and cooling systems are operating properly.
Owners should consider adding equipment-level performance indicators where suitable sensors and control-system data are available.
| HVAC Metric | What It Helps Identify |
|---|---|
| HVAC runtime | Equipment operating longer than expected |
| Chiller electricity consumption | Changes in cooling-system energy demand |
| Boiler fuel consumption | Heating-system consumption patterns |
| Supply-air temperature | Whether air is being delivered at the intended temperature |
| Return-air temperature | Changes in system load and performance |
| Chilled-water supply and return temperatures | Cooling-loop operating conditions |
| Simultaneous heating and cooling | Potential control conflicts or scheduling problems |
| Equipment alarm frequency | Repeated faults requiring maintenance |
These indicators are diagnostic tools, not universal pass/fail requirements. Their useful thresholds depend on equipment type, system design, operating conditions, and manufacturer guidance.
Example: A Chiller Operating Outside Its Expected Pattern
Suppose a building's dashboard shows that its chiller is running for 15 hours every day, even when occupancy is lower and outdoor conditions are relatively mild.
That pattern deserves investigation.
Possible causes include:
- Incorrect operating schedules.
- Poor sequencing between chillers.
- Cooling demand from equipment that operates continuously.
- Control sensors that are incorrectly calibrated.
- Simultaneous heating and cooling in different zones.
- Problems with chilled-water flow or heat transfer.
The dashboard should help the facility team move from a consumption spike to a specific piece of equipment or operating condition that can be investigated.
7. Occupancy and Operating Hours: Put Energy Use Into Context
A building that operates for 16 hours each day should not be assessed in exactly the same way as a building that operates for eight hours.
Similarly, an office with 900 occupants may use more energy than it did when only 500 people were present, even if its systems are operating efficiently.
This is why energy dashboards should include operational context.
Useful supporting indicators include:
- Occupied hours per day.
- Occupancy trends, where reliable data is available.
- Weekday versus weekend energy consumption.
- After-hours electricity consumption.
- HVAC operating hours.
- Tenant operating schedules.
- Special events or temporary building activities.
One particularly useful measure is after-hours energy consumption.
For example, if an office consumes 18,000 kWh during its normal operating period and another 7,000 kWh overnight, the overnight usage deserves investigation.
It does not automatically mean that all overnight consumption is waste. Refrigeration, server rooms, security systems, pumps, ventilation, and other essential loads may operate continuously.
The objective is to distinguish necessary base loads from unnecessary operating hours.
8. Data Quality: The Metric That Determines Whether Other Metrics Can Be Trusted
A dashboard can look accurate while displaying incomplete or misleading information.
Missing utility bills, incorrect meter assignments, duplicate readings, estimated consumption, and outdated floor-area information can distort the performance indicators used by owners.
Data quality should therefore be displayed as a dashboard category rather than treated as an administrative task performed only during annual reporting.
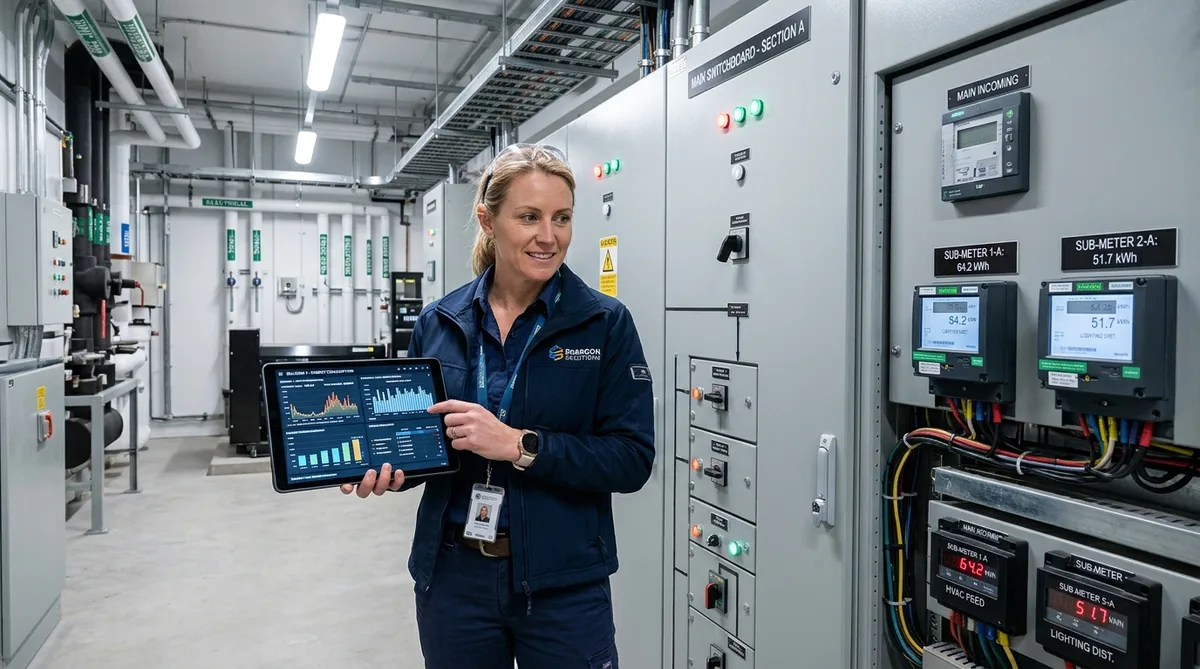 Accurate energy dashboards require verifiable meter data. Building operators must audit physical digital submeters and confirm meter-to-building mapping.
Monitor:
| Data Quality Indicator | What to Check |
|---|---|
| Meter coverage | Whether all relevant energy meters are included |
| Missing billing periods | Whether any months lack usage data |
| Estimated readings | Whether utility data contains estimates |
| Duplicate entries | Whether the same consumption has been recorded twice |
| Billing-period length | Whether comparisons use consistent periods |
| Property floor area | Whether the gross floor area is current and accurate |
| Meter-to-building mapping | Whether meters are assigned to the correct property |
| Data refresh date | How recently the dashboard was updated |
This becomes especially important when multiple buildings share a tax lot or utility arrangement. The owner should know which meter belongs to which building and which loads are included in each measurement.
A dashboard should visibly flag missing or estimated data. It should not silently turn incomplete information into a confident-looking annual performance figure.
9. Water Consumption: A Separate but Useful Building Performance Indicator
Although the main purpose of an energy dashboard is to monitor energy, water consumption can provide another useful view of building operations.
NYC's Local Law 84 benchmarking process includes annual energy and water assessment for applicable covered buildings.
Owners can monitor:
- Monthly water consumption.
- Annual water use intensity.
- Water cost.
- Consumption per occupied unit or tenant, where appropriate.
- Unusual overnight water flow, where interval metering is available.
- Changes in consumption following plumbing or fixture upgrades.
A sudden increase in water consumption may indicate a leak, malfunctioning fixture, irrigation issue, or change in occupancy.
For multifamily properties, water consumption per residential unit may provide more operational insight than simply comparing total gallons between buildings of different sizes.
Water should remain a separate dashboard category because it is not an energy-consumption metric, even though it is relevant to overall building management and NYC benchmarking.
10. The Practical Dashboard: Which Metrics Belong on the Main Screen?
Not every metric deserves equal visibility.
Owners should prioritize a small group of indicators that communicate building performance quickly. Detailed equipment measurements, sensor readings, and diagnostic trends can sit behind the main dashboard.
A practical layout could look like this:
| Dashboard Section | Primary Metrics | Suggested Review |
|---|---|---|
| Energy performance | Monthly energy use, weather-normalized EUI | Monthly |
| Financial performance | Utility expenditure, cost per sq. ft., demand charges | Monthly |
| Electrical demand | Peak kW, peak time, demand trend | Daily or monthly |
| Emissions | Annual CO₂e, projected emissions, LL97 margin where applicable | Monthly or quarterly |
| HVAC operations | Runtime, equipment energy, alarms, temperature trends | Daily or weekly |
| Occupancy and schedules | Operating hours, after-hours consumption | Weekly |
| Data quality | Missing bills, estimated readings, meter coverage | Monthly |
| Water performance | Monthly gallons, water cost, water intensity | Monthly |
The review frequency is a management recommendation, not a statutory reporting schedule. Interval-meter and building automation data may support daily or even more frequent checks, while utility-bill metrics are generally updated when new billing data becomes available.
What Should Be on the Main Screen?
For an owner who wants a simple overview, the first screen should contain:
- Total energy consumption.
- Weather-normalized EUI.
- Monthly utility expenditure.
- Peak electrical demand.
- Total and projected greenhouse gas emissions.
- HVAC operating alerts.
- Data completeness status.
The rest of the dashboard should help explain why any of these indicators changed.
11. How Often Should Building Owners Review Energy Dashboard Metrics?
The correct review frequency depends on the type of data and the decision being made.
- Daily or weekly: Facility teams should review unusual equipment alarms, unexpected HVAC runtime, peak demand events, and after-hours energy consumption when interval or building automation data is available.
- Monthly: Owners and property managers should review utility expenditure, electricity and fuel consumption, EUI trends, water use, and data completeness.
- Quarterly: Management should review emissions projections, energy-reduction targets, equipment performance, and progress against planned efficiency projects.
- Annually: The building should undergo a broader review of benchmarking results, emissions performance, energy-saving investments, and applicable compliance obligations.
An annual review alone is usually too slow to identify operational problems. A daily review of every sensor reading, on the other hand, can create unnecessary work. The dashboard should match the frequency of the decision.
12. How Energy Dashboards Support NYC Local Law Compliance
Energy dashboards can support several NYC building sustainability requirements, but they do not replace the required reporting processes.
Local Law 84: Annual Energy and Water Benchmarking
Local Law 84 requires applicable buildings to benchmark their energy and water consumption through ENERGY STAR Portfolio Manager and submit the required information to the City annually.
A dashboard can help maintain the underlying information, identify missing utility periods, and review EUI and other performance trends before benchmarking data is submitted.
Local Law 97: Building Emissions Limits
For applicable covered buildings, owners need to monitor greenhouse gas emissions against the relevant annual limits under Local Law 97.
An effective LL97 dashboard should track the regulatory emissions calculation, annual limit, projected year-end performance, and remaining emissions margin.
This makes it easier to identify potential compliance problems before the reporting period ends.
Local Law 87: Energy Audits and Retro-Commissioning
Applicable buildings must complete Local Law 87 energy audits and retro-commissioning at the required intervals.
A dashboard can support the process by maintaining historical consumption data, tracking equipment operating conditions, and monitoring the results of implemented energy conservation measures.
However, dashboard monitoring does not replace the required audit or retro-commissioning work.
Local Law 33/95: Energy Efficiency Grades
Energy efficiency grades are derived from benchmarking information for applicable buildings.
Tracking the information that contributes to benchmarking performance can help owners understand changes in their building's energy performance and identify areas for improvement.
The grade is a useful public-facing indicator, but it should not replace operational metrics such as energy use, demand, utility costs, and emissions.
13. Common Energy Dashboard Mistakes Owners Should Avoid
A dashboard can create a false sense of control when its metrics are poorly selected or interpreted.
- Tracking total energy without considering weather: A colder winter or hotter summer can increase consumption even when equipment performance has not deteriorated. Weather-normalized comparisons help separate these effects.
- Using one EUI target for every building: A hospital, office, hotel, and multifamily property have different operating profiles. Comparing them using an identical target is misleading.
- Confusing kWh with kW: Energy consumption and peak demand describe different aspects of electrical usage. Both can affect operating costs.
- Ignoring utility prices: A higher energy bill does not always mean a building consumed more energy. Supply rates, delivery charges, taxes, and demand charges can change independently.
- Treating an ENERGY STAR score as a complete compliance report: The score is a comparative performance indicator for eligible property types. It does not establish LL97 compliance.
- Displaying data without ownership: Someone must be responsible for investigating alerts, correcting meter assignments, reviewing bills, and confirming that corrective actions have worked.
- Adding sensors without a decision-making purpose: More monitoring equipment creates additional costs and data-management work. Every new measurement should support a defined operational or management decision.
Conclusion: Build a Dashboard Around Decisions, Not Numbers
An effective building energy dashboard does not need to display every available metric. It needs to show the indicators that help owners understand consumption, control costs, identify operational problems, and manage emissions exposure.
For most NYC property owners, the essential starting point is a combination of weather-normalized EUI, monthly energy consumption, utility expenditure, peak electrical demand, greenhouse gas emissions, HVAC performance, and data quality.
More advanced dashboards can add equipment-level analytics, occupancy trends, fault detection, and automated alerts.
The important distinction is between collecting data and acting on it. A dashboard becomes valuable when it helps an owner recognize an unexpected change, understand its cause, assign corrective action, and verify the result.