Learn about LL97 carbon offsets, renewable energy credits (RECs), deductions, and whether purchasing clean energy credits can avoid emissions penalties.
BY NYC Energy Code Team
ON
8 October 2026
How Emission Factors Work: Why Electricity Is Getting Cleaner on Paper
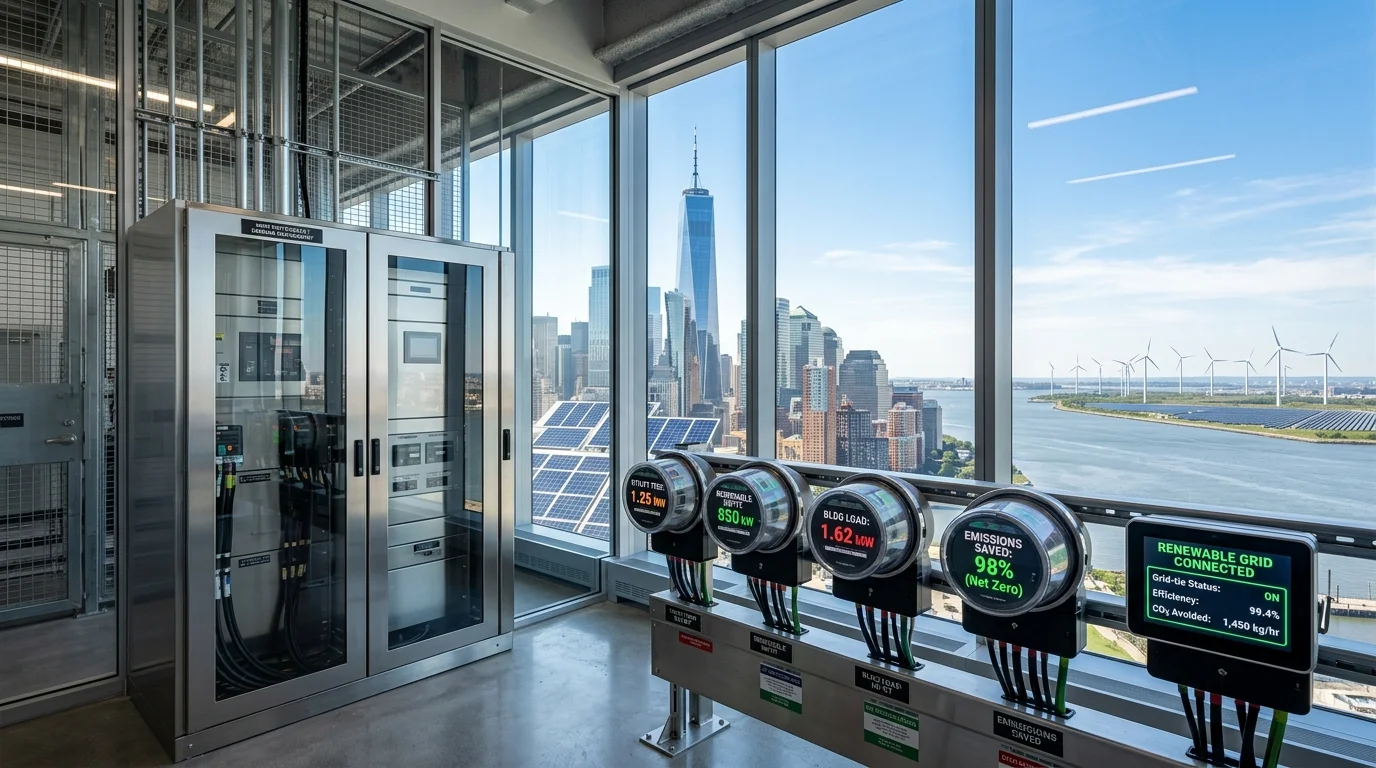
A building can use exactly the same amount of electricity this year as it did last year and still report lower greenhouse-gas emissions.
How?
The answer is the emission factor used to convert energy consumption into estimated greenhouse-gas emissions.
This can seem strange at first. The building's electric meter still says the same thing. The lights consumed the same number of kilowatt-hours. The HVAC system ran just as long.
What changed is the emissions intensity assigned to the electricity.
As the electricity grid incorporates more lower-carbon generation, the average emissions associated with producing each unit of electricity can decline. EPA's electricity emissions datasets, including eGRID, reflect power-plant generation and emissions data and are updated as newer information becomes available. (epa.gov)
That is why electricity can become “cleaner on paper” even before a building changes its own electricity consumption.
What Is an Emission Factor?
An emission factor is essentially a conversion rate.
It answers:
“How much greenhouse-gas emissions are associated with one unit of energy?”
For electricity, the basic calculation is:
Electricity consumption × electricity emission factor = associated emissions
For example, imagine a building consumes:
1,000,000 kWh/year
If the applicable factor is:
0.40 kg CO₂e/kWh
then the calculated emissions would be:
1,000,000 × 0.40 = 400,000 kg CO₂e
or:
400 metric tons CO₂e
Now suppose the same building uses exactly:
1,000,000 kWh/year
but the applicable factor falls to:
0.30 kg CO₂e/kWh
The calculated emissions become:
300 metric tons CO₂e
Nothing changed at the building's electric meter.
The emissions factor changed.
Why Electricity Emission Factors Change
The electricity grid is not powered by one type of generator.
A regional grid can include a mixture of:
Natural gas + nuclear + hydropower + wind + solar + other generation sources
The mix changes over time as older generation retires and new generation comes online.
When the average carbon intensity of the grid decreases, an electricity emission factor based on that grid can decrease as well.
EPA's eGRID provides regional electricity generation, emissions, and emissions-rate information based on data from electricity generators and other sources. (epa.gov)
So when the grid becomes less carbon-intensive, each kilowatt-hour consumed can carry a lower calculated emissions intensity.

“Cleaner on Paper” Does Not Mean the Building Became More Efficient
This distinction is critical.
Imagine:
Building A
2025 electricity use: 1,000,000 kWh
2026 electricity use: 1,000,000 kWh
The building did not reduce its electricity consumption.
But if the electricity emission factor decreases, the building's reported electricity-related emissions can still decline.
That means:
Energy efficiency = how much energy the building uses
while: Emissions intensity = how much carbon is associated with each unit of energy
These are related, but they are not the same thing.
A building owner should therefore avoid claiming:
“Our building became 20% more energy efficient.”
when the underlying electricity consumption stayed the same and only the emissions factor changed.
A more accurate statement would be:
“Reported electricity-related emissions decreased because the applicable electricity emissions factor became lower.”
Energy Use and Carbon Are Two Different Measurements
Consider two buildings that both consume:
1,000,000 kWh/year
If they are in regions with different electricity-generation mixes, the associated emissions can be different.
That means the same energy consumption does not necessarily produce the same calculated carbon footprint.
This is one reason carbon reporting needs both:
- Activity data: tells you what happened
- Emission factors: converts that activity into an emissions estimate
What Happens to Building Emissions When the Grid Gets Cleaner?
Suppose an all-electric building is powered by the grid.
Its electricity consumption remains constant:
1,000,000 kWh/year
Over time, the regional grid's average emissions intensity declines.
The building's reported electricity-related emissions may therefore follow this general pattern:
| Year | Electricity Use | Emission Factor | Calculated Emissions |
|---|---|---|---|
| Year 1 | 1,000,000 kWh | 0.40 kg/kWh | 400 tCO₂e |
| Year 2 | 1,000,000 kWh | 0.35 kg/kWh | 350 tCO₂e |
| Year 3 | 1,000,000 kWh | 0.30 kg/kWh | 300 tCO₂e |
The values are illustrative.
The building has not become more energy efficient.
The carbon intensity of the electricity supply has changed.
How ENERGY STAR Portfolio Manager Handles Emission Factors
This distinction matters for NYC buildings using ENERGY STAR Portfolio Manager.
Portfolio Manager calculates greenhouse-gas emissions by multiplying a property's energy consumption by the applicable emission factor for each fuel. For electricity, Portfolio Manager generally uses a regional electricity emission factor based on EPA's eGRID data. (energystar.gov)
Importantly, Portfolio Manager uses historical emission factors for each year.
So the emissions calculation for one reporting year is based on the factor applicable to that year's data rather than simply using today's factor for every historical year. (energystar.gov)
This is one reason an owner's historical carbon data can change when comparing different years.
The energy consumption may be comparable, but the conversion factor can differ.
Does This Affect Your ENERGY STAR Score?
No.
This is one of the most useful distinctions for property managers.
ENERGY STAR states that emissions calculations have no bearing on a property's 1–100 ENERGY STAR score or other energy metrics. (energystar.gov)
Emission factor ↓ → reported GHG emissions ↓ does not automatically mean: ENERGY STAR score ↑
The score and emissions are separate measurements.
This prevents a common misunderstanding when reviewing Portfolio Manager data.
Location-Based vs. Market-Based Electricity Emissions
Corporate carbon accounting introduces another layer.
The GHG Protocol's Scope 2 Guidance uses two approaches for purchased electricity:
• Location-based accounting
• Market-based accounting
The location-based method uses average emissions factors for the electricity grids supplying the facility.
The market-based method reflects contractual choices about electricity supply, such as qualifying supplier-specific instruments or renewable-energy contracts. (ghgprotocol.org)
This is important because a building can have:
One electricity meter → but potentially different reported Scope 2 emissions depending on the accounting method
For a company's ESG report, therefore, the question is not just:
“How much electricity did we buy?”
It is also:
“Which accounting methodology are we using?”
Why Renewable Electricity Can Change the Calculation
Suppose a company purchases qualifying renewable electricity under an applicable contractual arrangement.
Under the GHG Protocol market-based approach, qualifying contractual instruments can result in a different reported emissions factor from the regional grid average. (ghgprotocol.org)
That is fundamentally different from saying:
“The regional grid got cleaner.”
One is an accounting treatment associated with the electricity product purchased.
The other is a change in the average physical electricity-generation mix represented by a grid factor.
These concepts should not be mixed.
What About NYC LL97?
For NYC building owners, emission-factor discussions can become especially important because Local Law 97 uses its own regulatory framework for calculating building emissions.
That means a building owner should not take an emissions number from an ESG platform or corporate GHG inventory and automatically assume it is the number used for LL97 compliance.
NYC's LL97 rules establish specific greenhouse-gas-emissions calculations, limits, deductions, and reporting requirements.
In other words:
Portfolio Manager emissions ≠ automatically LL97 emissions
and: Corporate Scope 2 emissions ≠ automatically LL97 emissions
The appropriate factor and calculation method depend on the specific purpose of the analysis.

Why the Difference Matters for Electrification
Suppose a building replaces a gas boiler with an electric heat pump.
Before:
Natural gas → onsite combustion → direct emissions
After:
Electricity → heat pump → purchased electricity emissions
The building may reduce direct fossil-fuel emissions, but electricity-related emissions remain relevant.
As the electricity grid becomes cleaner, the emissions associated with electrically powered heating can also decline.
That creates an important long-term advantage:
Electrification + cleaner grid = potentially increasing carbon benefit over time
This is one reason electrification can be a strategic long-term decision even when the immediate emissions advantage varies by electricity mix.
Why Emission Factors Matter in Retrofit Planning
Imagine an owner comparing two heating strategies.
Strategy A: High-Efficiency Gas Boiler
Lower immediate capital complexity but continued fossil-fuel use.
Strategy B: Electric Heat Pump
Higher electrical infrastructure requirements but potential long-term emissions benefits as the grid becomes less carbon-intensive.
The financial and carbon analysis should therefore consider more than today's emission factor.
A useful question is:
“What is this system likely to look like over its useful life as the electricity supply changes?”
That is a much more strategic approach than optimizing purely around today's carbon intensity.
Emission Factors Can Make Progress Look Better—or Worse
The same principle works in reverse.
If an applicable emission factor becomes higher, a building's calculated emissions can rise even if its energy consumption does not change.
That means year-to-year carbon trends should always be interpreted alongside:
Energy consumption + emission factors + fuel mix + reporting methodology
This is particularly important when preparing ESG reports or explaining carbon performance to investors and stakeholders.
A Better Way to Read Your Carbon Data
When reviewing a building's annual results, don't stop at:
“Emissions went down 12%.”
Ask:
- Did energy use fall?
- Did the emissions factor change?
- Did the building switch fuels?
- Did electricity sourcing change?
- Did the reporting methodology change?
That five-question check can prevent a misleading sustainability conclusion.
A Simple Building Example
Consider an office building that consumes:
800,000 kWh/year
Its electricity consumption remains stable over three years.
But the calculated carbon emissions decline.
An owner might initially conclude:
“Our efficiency program is working.”
Then the data is reviewed more carefully.
The actual result is:
Electricity use → unchanged
Grid emission factor → declined
Calculated electricity emissions → declined
The building's carbon footprint improved under the applicable accounting method, but the building itself did not reduce its energy consumption.
That distinction does not make the reduction meaningless.
It simply tells you what caused it.
Common Mistakes
Treating Emission Factors as Permanent
Emission factors are datasets and methodologies that can change as updated generation and emissions information becomes available.
Calling Lower Carbon “Lower Energy Use”
A lower emissions factor can reduce reported emissions without changing electricity consumption.
Mixing Different Accounting Methods
Location-based, market-based, Portfolio Manager, and regulatory methodologies can produce different results.
Using One Factor for Every Year
Some systems, including Portfolio Manager, use historical factors corresponding to the reporting year. (energystar.gov)
Comparing Carbon Numbers Without Checking the Boundary
An organizational Scope 2 number, a Portfolio Manager emissions number, and an LL97 regulatory calculation may not represent the same scope or methodology.
How Building Owners Should Track Emissions
A useful dashboard should separate the physical activity from the calculated impact.
For example:
| Metric | What It Tells You |
|---|---|
| kWh consumed | Actual electricity use |
| kWh/sq. ft. | Energy intensity |
| Electricity emission factor | Carbon intensity of electricity |
| tCO₂e | Calculated emissions |
| ENERGY STAR score | Relative energy performance |
| LL97 emissions | Regulatory emissions under applicable NYC methodology |
This approach makes it much easier to distinguish between genuine efficiency improvements and changes caused by the emissions accounting factor.
Conclusion
Emission factors are the bridge between energy consumption and greenhouse-gas emissions.
For electricity, the factor can change as the generation mix and emissions profile of the supplying grid change. EPA's eGRID provides regional electricity emissions and generation data, while platforms such as ENERGY STAR Portfolio Manager use applicable historical factors to calculate building emissions. (epa.gov) (energystar.gov)
That means a building can report lower electricity-related emissions even when its electricity consumption has not changed.
This is why electricity can become “cleaner on paper.”
But the phrase should not be misunderstood. A lower emissions factor does not mean the building automatically became more energy efficient. It means that each unit of electricity is being assigned a lower emissions intensity under the applicable methodology.
For NYC property owners, this distinction becomes even more important because LL84/Portfolio Manager, corporate GHG accounting, and LL97 do not necessarily use identical emissions methodologies.
The smartest approach is therefore to track both sides of the equation:
How much energy are we using?
and: How carbon-intensive is that energy?
That gives owners a much clearer picture of whether their emissions reductions are coming from better building performance, a cleaner energy supply, or both.
Frequently Asked Questions
An electricity emission factor is a value used to convert electricity consumption into estimated greenhouse-gas emissions. It typically represents the emissions intensity associated with electricity generation for a particular region or electricity product.
They can change as the electricity generation mix changes and updated emissions and generation data become available. EPA's eGRID provides updated regional generation and emissions information used in many U.S. electricity emissions calculations. (epa.gov)
Yes. If the applicable electricity emission factor decreases, calculated electricity-related emissions can decline even when the building consumes the same number of kilowatt-hours.
No. Energy efficiency is about reducing energy consumption for a given level of building service or activity. A lower emission factor means the energy supply has a lower emissions intensity under the applicable accounting methodology.
Yes. Portfolio Manager calculates greenhouse-gas emissions by multiplying energy use by applicable emission factors and generally uses regional electricity factors based on EPA eGRID data. (energystar.gov)
No. EPA states that emissions calculations have no bearing on the property's 1–100 ENERGY STAR score or other energy metrics. (energystar.gov)
Location-based Scope 2 uses average grid emissions factors for the electricity supplied to a facility. Market-based Scope 2 reflects emissions associated with qualifying contractual electricity-supply instruments. (ghgprotocol.org)
It can, particularly when electric equipment replaces onsite fossil-fuel combustion and the electricity supply has a relatively low or declining emissions intensity. The actual result depends on the equipment efficiency, fuel displaced, electricity mix, and accounting methodology.
Not automatically. LL97 uses its own regulatory calculation methodology. Owners should use the factors and rules applicable to the specific LL97 reporting and compliance period rather than assuming that a Portfolio Manager or corporate GHG factor applies.
kWh shows whether the building is actually using less energy. tCO₂e shows the estimated climate impact under the selected emissions methodology. Looking at both helps distinguish energy-efficiency improvements from changes in the carbon intensity of the energy supply.