BY NYC Energy Code Team
ON
17 October 2026
Why Your Building's Energy Use Jumped After a Mild Year: Common Data Errors

Your building used more energy last year—even though the weather was milder. Heating demand should have been lower, utility bills were expected to improve, and no major equipment upgrades were made. Yet the annual energy report shows a noticeable increase in consumption.
Before assuming the HVAC system has become inefficient, investigate the data behind the numbers.
A building's reported energy consumption depends on more than its actual equipment performance. Utility billing periods, missing meter readings, duplicated entries, fuel records, floor-area calculations, and changes in how a property is categorized can all affect benchmarking results.
For NYC property owners, the consequences can extend beyond confusing utility reports. Inaccurate data can distort Energy Use Intensity (EUI), affect performance comparisons, and complicate annual benchmarking under Local Law 84.
The first step is to determine whether energy consumption genuinely increased or whether the reported increase reflects an error in the underlying data. Only then can you decide whether the building needs operational changes, an energy audit, or a correction to its benchmarking records.
Data Errors vs. Equipment Failures in NYC Benchmarking
When reported building energy use spikes after a mild weather year, up to 70% of unexpected anomalies stem from utility billing gaps, duplicate data imports, estimated meter readings, or updated gross floor area denominators in ENERGY STAR Portfolio Manager—not physical mechanical malfunctions.
Why Mild Weather Does Not Guarantee Lower Energy Use
A mild year can reduce the energy needed for space heating during a cold season. However, weather is only one influence on a building's annual consumption.
Cooling demand may rise during warmer periods, even when the winter is mild. Occupancy can increase, tenants may extend operating hours, and equipment such as computers, kitchen appliances, ventilation systems, or process equipment may run longer.
Fuel switching can also complicate the comparison. A property that replaces a fuel-burning heating system with electric heat pumps may consume less fuel but more electricity. Looking at electricity alone would give an incomplete picture of total energy use.
The first distinction to make is between actual energy use and weather-normalized energy use.
Actual site energy reflects the energy consumed at the property during the reporting period. Weather-normalized site energy estimates the consumption the property would have had under typical weather conditions, helping distinguish weather-related variation from other changes.
ENERGY STAR Portfolio Manager provides weather-normalized energy metrics for eligible properties and can help owners compare building performance across different weather conditions. These metrics do not automatically correct inaccurate meter records or explain every change in consumption. Source: ENERGY STAR Portfolio Manager Glossary.
1. Missing Utility Bills and Incomplete Meter Coverage
Data Error 1
Uncovered Calendar Days and Missing Billing Cycles
One of the first things to check is whether the report includes a complete year of energy consumption.
Suppose an office building's annual electricity report includes 12 entries, but one billing period covers only 18 days while another covers 45 days. The number of entries may look reasonable, yet the dates may not provide complete coverage of the calendar year.
Depending on how the records are entered and which periods are included, missing consumption can make one year appear unusually low or produce an unreliable comparison with the next year.
ENERGY STAR Portfolio Manager identifies meter-data gaps when some dates are not covered by a bill. It also flags overlapping billing periods when the same dates appear in multiple entries. For bills that run from mid-month to mid-month, the platform notes that 13 bills may be needed to cover 12 full calendar months. Source: ENERGY STAR Portfolio Manager data-quality definitions. For NYC buildings, the comparison should cover the appropriate reporting year—January 1 through December 31 for annual benchmarking—and account for every relevant energy source.
2. Duplicate Bills or Overlapping Meter Entries
Data Error 2
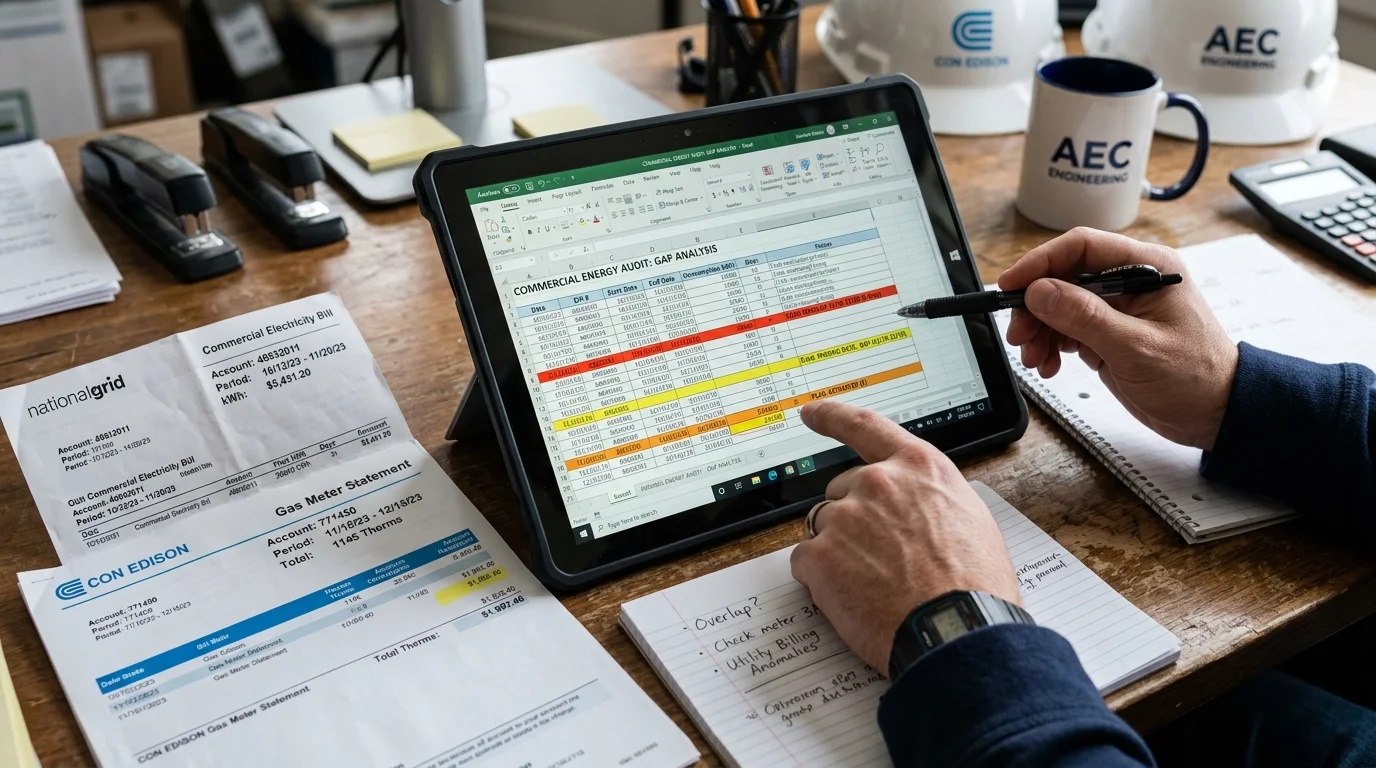
Automated Utility Sync Overlapping with Manual Entries
Duplicate entries can inflate reported energy consumption without any change in the building's physical operation.
Imagine that an electricity bill is entered manually, then the same period is imported again through a utility-data connection. If the records are not reconciled properly, some consumption may be counted more than once.
The reverse can happen when a meter is accidentally omitted or deactivated even though it still serves the property.
To investigate, compare the meter inventory with utility statements, bill dates, account numbers, and consumption amounts. Pay particular attention to periods where a property's reported use changes sharply but the equipment, occupancy, and operating schedules remain broadly stable. A legitimate overlap between separate meters serving different loads is not necessarily an error. The problem occurs when the same consumption is represented more than once or the meter configuration fails to reflect how the property is actually served.
3. Estimated Readings Mistaken for Actual Consumption
Data Error 3
Unreconciled Utility Estimates and Subsequent Catch-Up Bills
Not every utility entry is based on an actual meter reading. Utilities may issue estimated bills and later reconcile them against actual readings.
Estimated values are not automatically incorrect, but they deserve attention when investigating unusual year-to-year changes.
For example, an estimated bill may initially overstate consumption, followed by a later adjustment. If the records are incomplete or the adjustment is misunderstood, the annual comparison may become misleading.
ENERGY STAR Portfolio Manager allows users to flag estimated meter entries, making it possible to identify whether reported data contains estimates. Source: ENERGY STAR Portfolio Manager — Estimated Data Flag. When an unexpected increase appears, review the original utility statements and distinguish actual readings from estimated ones. Confirm that later corrections are reflected correctly and that the same consumption has not been recorded twice.
4. Incorrect Gross Floor Area
Data Error 4
Distorted EUI Denominators After Area Adjustments
Energy use is often evaluated relative to the building's size. If the recorded floor area is incorrect, the resulting Energy Use Intensity can be misleading even when the utility data itself is accurate.
The basic Energy Use Intensity calculation is:
EUI = Annual Energy Use (kBtu) / Gross Floor Area (sq ft)
For example, consider a building consuming 6,000,000 kBtu annually. If its recorded area is 100,000 square feet:
EUI = 6,000,000 kBtu / 100,000 sq ft = 60 kBtu/ft²
Now suppose a data correction changes the recorded area to 80,000 square feet:
EUI = 6,000,000 kBtu / 80,000 sq ft = 75 kBtu/ft²
The reported EUI rises from 60 to 75 even though annual energy consumption has not changed. This represents a 25% increase in EUI caused entirely by the change in the denominator.
For NYC benchmarking, confirm that the reported gross floor area reflects the property and its applicable uses, including relevant shared and common spaces. NYC DOB specifically advises owners to verify floor-area totals and ensure that individual property-use areas add up to the building's total gross floor area. Source: NYC DOB — Local Law 84 Benchmarking.

5. Missing Fuel Sources or Incorrect Meter Selection
Data Error 5
Unrecorded Fuel Deliveries and Partial Electrification
An electricity-only report may suggest that energy consumption has jumped when the larger picture tells a different story.
Consider a property that previously used natural gas for heating but installed electric heat pumps. The electricity meter now records more consumption because it serves a larger share of the building's heating load, while gas consumption declines.
If the report includes electricity but omits gas—or compares different combinations of meters across years—the result will not represent the full change in energy use.
The same problem can occur with fuel oil, district energy, or other sources that are manually entered rather than obtained through the primary utility connection.
Review the meter list and confirm that each energy source is represented appropriately. Check whether the reporting scope changed, whether meters were assigned to the correct property, and whether shared meters serving multiple buildings have been handled consistently. NYC's benchmarking instructions explain that whole-building energy reporting may require tenant consumption in addition to base-building use, and that fuel oil or other energy not supplied by the relevant utilities may need to be entered manually. Source: NYC DOB — Benchmarking Requirements.
6. Incorrect Property Type or Building Use
Data Error 6
Misaligned Peer Reference Groups and Operating Schedules
Benchmarking results can become unreliable when the property's recorded use no longer reflects how the building operates.
For example, an office building may have been converted to include medical offices, retail space, or another use. Changes in occupancy, operating hours, equipment intensity, and ventilation requirements may affect the building's actual consumption as well as the benchmarking information used to evaluate it.
If the property details are outdated, the report may compare the building against an unsuitable reference group or use incorrect operating information for relevant performance metrics.
NYC DOB advises owners to review the property's primary and secondary property types and update building details when necessary. Single-use buildings must use an appropriate property type rather than selecting a generic category simply because it seems convenient. Source: NYC Local Law 84 guidance. The objective is not to choose the property type that produces the best score. It is to describe the actual building accurately.
7. Confusing Energy Consumption, Energy Cost, and EUI
These three measures describe different things, and mixing them can make an ordinary change look like a performance problem.
| Metric | What It Measures | What Can Cause It to Change? |
|---|---|---|
| Energy Consumption | The energy used during a period (kWh, therms, kBtu) | Equipment operation, occupancy, weather, meter coverage, or data corrections |
| Energy Cost | The amount charged for energy ($ dollars) | Consumption, utility rates, demand charges, billing adjustments, and tariffs |
| Energy Use Intensity (EUI) | Energy consumption divided by floor area (kBtu/sq ft) | Energy use, recorded floor area, and reporting scope |
A building's energy costs may rise even when consumption stays steady because the electricity rate or demand charges increased.
Similarly, EUI can rise without an increase in total energy consumption if the recorded gross floor area decreases. Conversely, total consumption may rise while EUI falls if the building's recorded area increases substantially.
Before investigating equipment, identify which metric has changed. Comparing annual kWh, natural gas consumption, total energy use, EUI, and utility cost side by side gives a more reliable picture than relying on a single annual score.
A Practical NYC Office Example
Imagine a hypothetical 100,000-square-foot NYC office building. Its reported annual electricity consumption rises from 1,200,000 kWh to 1,380,000 kWh after a comparatively mild year.
The apparent increase is:
((1,380,000 kWh - 1,200,000 kWh) / 1,200,000 kWh) × 100 = 15% Increase
A 15% increase deserves investigation, but it does not prove that the building became 15% less efficient.
The property manager should check the following in sequence:
1
Validate the Dates
Confirm that both reporting periods include the same complete calendar year and that bills have no gaps or unintended overlaps.
2
Reconcile the Meters
Compare utility accounts and meter records to identify duplicated entries, omitted accounts, or changes in meter coverage.
3
Verify the Building Information
Confirm that gross floor area, property use, operating hours, and the reporting scope remained consistent.
4
Compare All Energy Sources
Determine whether electricity rose because of changed HVAC operation, electrification, tenant equipment, or missing fuel data in the earlier year.
5
Review Weather-Normalized Metrics and Operations
Compare heating and cooling patterns, equipment runtime, and occupancy. If the increase remains unexplained after the data is reconciled, investigate the equipment and control systems.
This sequence avoids spending money on an energy audit solely because of a potentially incorrect report, while preserving the need for technical investigation if the increase is real.
How to Audit the Data Before Blaming the Building
An effective first review is a reconciliation exercise, not necessarily a full engineering study.
Start by downloading the annual utility records and comparing them with the consumption entered into ENERGY STAR Portfolio Manager. Ensure that each meter covers the intended period, each fuel source is included, and the reported building characteristics match the records.
Next, use Portfolio Manager's error-checking tools and review warnings involving incomplete data, gaps, overlaps, missing meters, or unusually high or low EUI. NYC DOB also directs building owners to use the tool's Check for Possible Errors function and resolve relevant alerts before submitting benchmarking data.
The city's published guidance identifies EUI below 5 kBtu per square foot or above 1,000 kBtu per square foot as values requiring review. These are screening thresholds, not proof that every value outside the range is necessarily false. Source: NYC DOB — Benchmarking Data Quality Checks.
Once the records are consistent, review monthly consumption trends and relate them to equipment operation, tenant occupancy, and weather. If a large increase persists without an obvious operational explanation, a building engineer or energy professional can investigate system efficiency, HVAC scheduling, simultaneous heating and cooling, control faults, and equipment deterioration.
What NYC Building Owners Should Know About Benchmarking
Local Law 84 requires covered buildings to benchmark annual energy and water consumption using ENERGY STAR Portfolio Manager. NYC's covered-building criteria include individual buildings exceeding 25,000 gross square feet and certain groups of buildings meeting combined area thresholds, subject to the law's specific rules and exceptions.
The city requires eligible properties to report the complete consumption data for the applicable calendar year and advises owners to check that property identifiers, building details, meter records, and floor-area values are correct. The annual deadline is generally May 1, but owners should verify the applicable year's instructions and the current Covered Buildings List.
The reason for careful data validation is straightforward: benchmarking is intended to support consistent comparisons and better energy decisions. If the underlying information is incomplete or inaccurate, the resulting analysis may point owners toward the wrong response.
Official guidance: NYC Local Law 84 Benchmarking.
Conclusion
A mild year followed by a reported increase in building energy use is a reason to investigate—not immediate proof of failing HVAC equipment.
Missing bills, duplicated meter entries, estimated readings, incorrect floor area, omitted fuel sources, and outdated property-use information can all distort the results. At the same time, longer operating hours, increased cooling, tenant changes, and electrification may cause genuine increases even when the weather appears favorable.
For NYC property owners, the most reliable approach is to reconcile the utility records, confirm complete meter coverage, validate the property details, and compare both actual and weather-normalized energy metrics. If the increase remains after those checks, investigate building operations and equipment performance.
Accurate data is the starting point for accurate energy decisions. Before budgeting for an expensive retrofit, make sure the building's reported energy use represents what the property actually consumed.
Frequently Asked Questions
Weather is only one influence on annual consumption. Cooling demand, occupancy, operating hours, tenant equipment, fuel switching, incomplete utility records, and incorrect meter data may all contribute to an increase.
Actual energy use reflects consumption during the reporting period. Weather-normalized energy estimates consumption under typical weather conditions, making it easier to compare performance across years with different weather. It does not correct missing or duplicated meter entries.
Yes. EUI is energy consumption divided by gross floor area. If the recorded area decreases while consumption stays constant, the calculated EUI increases, even though the building has not consumed more energy.
Duplicate records may count the same energy consumption more than once and inflate the reported total. Reviewing meter identifiers, billing dates, account numbers, and consumption values can help identify the issue.
Yes. Estimated readings can affect reported totals, especially when later actual readings or billing adjustments are not reconciled properly. Portfolio Manager allows estimated meter entries to be flagged so users can identify them during a data-quality review.
Review the complete calendar-year data for each meter, confirm that every energy source is included, verify the property's floor area and use, and use Portfolio Manager's Check for Possible Errors function. Resolve relevant gaps, overlaps, and plausibility alerts before submission.
Not immediately in every case. First reconcile the utility records and building information. If the increase persists after the data is validated, an energy professional can investigate HVAC controls, equipment condition, operating schedules, and other potential causes.
No. Utility costs can rise because of changes in energy rates, demand charges, or billing adjustments even when consumption remains stable. Compare both the actual energy units consumed and the monetary charges to identify the cause.
No. It helps account for weather-related differences, but changes in occupancy, operating hours, equipment, property use, and data quality may still affect the comparison. Review those factors alongside the weather-normalized metrics.
You may also like